Bitcoin Price Analysis 2025 – what will the rest of the year bring? There is definitely a Trump crypto buzz. Traders are still asking about Trump
.cwp-coin-chart svg path {
stroke-width: 0.65 !important;
}
Price
Volume in 24h
<!–
?
–>
Price 7d
price impact. Especially when the price has fallen by 28%! Explore below what technical analysis has to say.
$BTC/usdt 4 hour
$93k –> $110k –> PRICE DISCOVERY
Easy peasy
https://t.co/pr2Ff4R27E pic.twitter.com/rifLdTcQgQ
— Satoshi Flipper (@SatoshiFlipper) March 5, 2025
The upcoming presidential crypto summit has significantly increased hope in the markets. As a result, we saw BTC price jump from $78,300 to $95,000 in two days time. To stay up to date and get some context, please read my previous article.
EXPLORE: Best Monero Wallets in 2025
Trump Bitcoin Price Impact and Technical Analysis
(BTCUSDT)
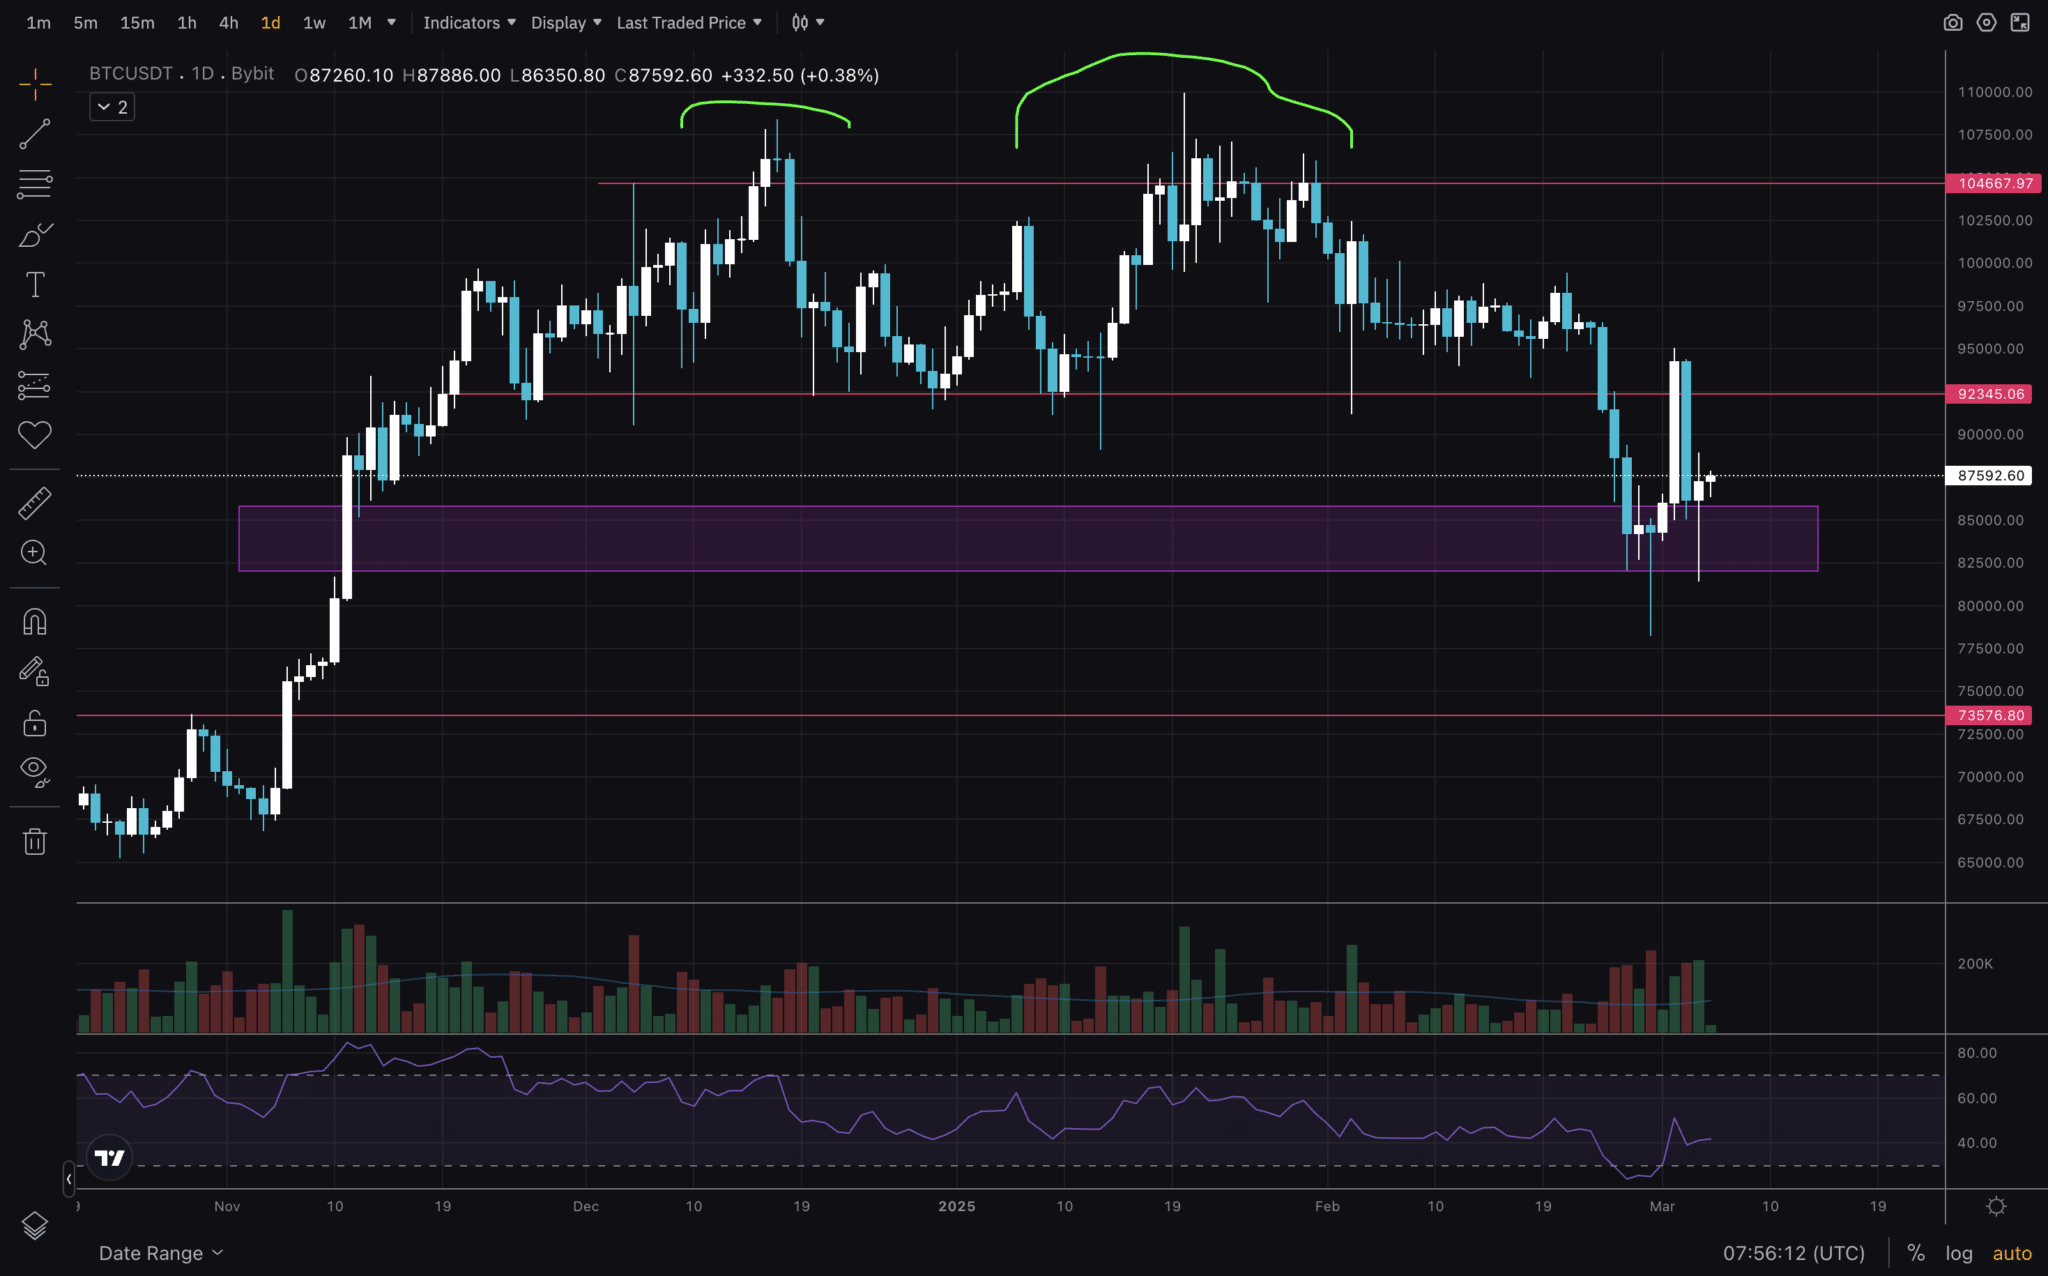
Let’s get on with our BTC Price Analysis 2025! On the 1D chart we are looking at the purple box, which we identified in the previous article as a gap. Or in other words, a zone that price has not revisited. It is nice to see that buyers showed interest in that area and created a level of support, which is holding so far. Price coming down to these levels also means that there was liquidity to be taken.

(BTCUSDT)
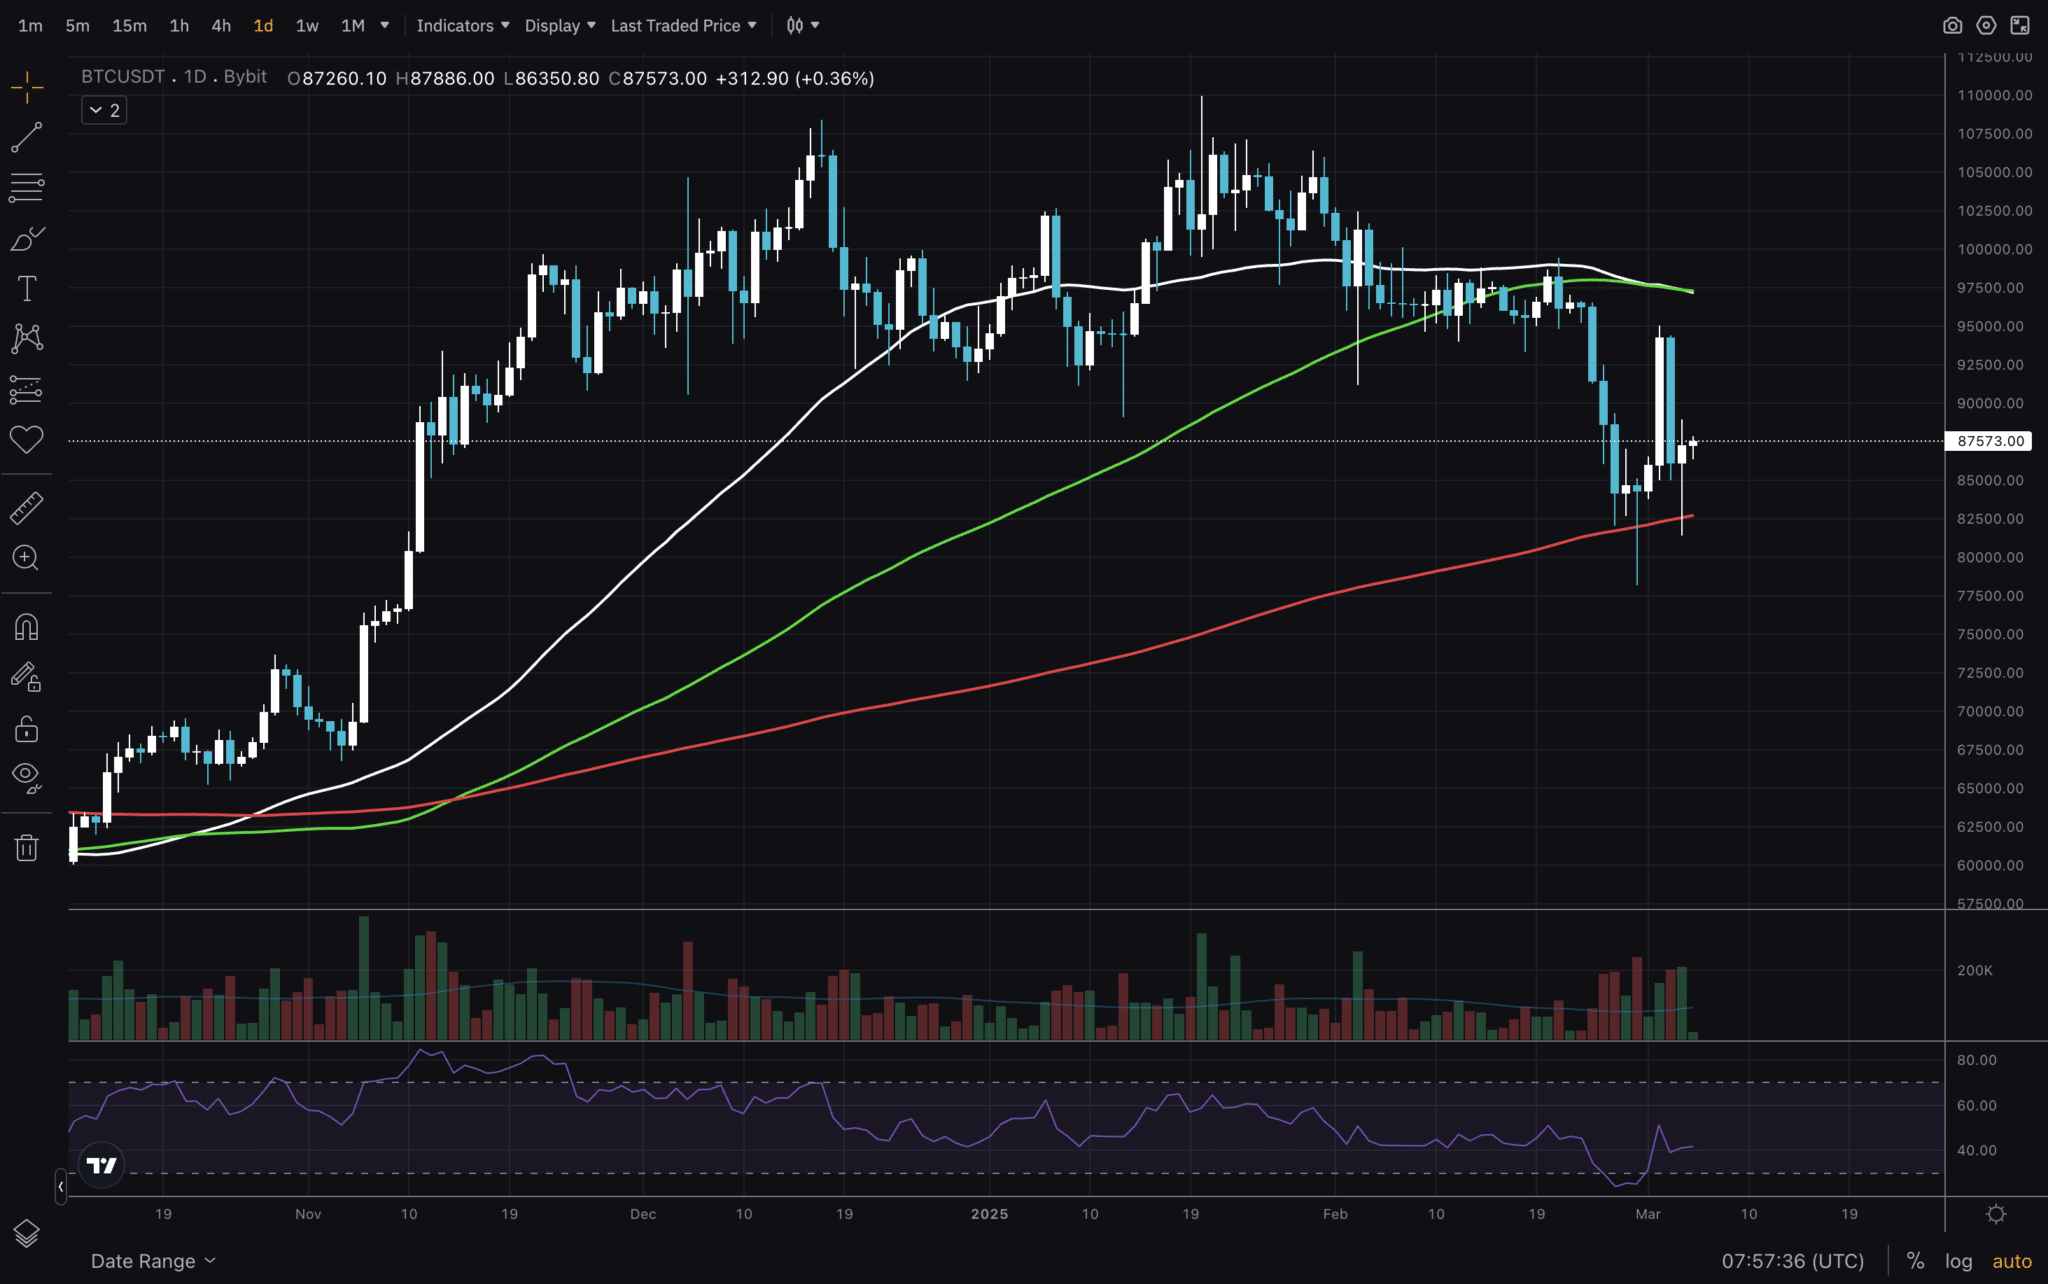
Next, we’re looking at the 1D chart again. I’ve separated the indicators into two charts, because if it’s all on one chart it’s too much clutter. A great mix for Bitcoin technical analysis in the midst of Trump crypto buzz. Zooming out on the Daily helps to cancel out the noise.
On the top chart we see the Fib level 0.618 holding well – a typical level for pullbacks in bull markets. And the next encouraging sight is the RSI level. Both times I have circled green when RSI was that low, we saw a bottom form. It did take about two months before price continued higher! This third time I would expect a similar outcome. How long will it take? Nobody knows.
On the bottom chart, we observe MA200 acting as support, as expected.
Bitcoin Market Structure Matters
(BTCUSDT)
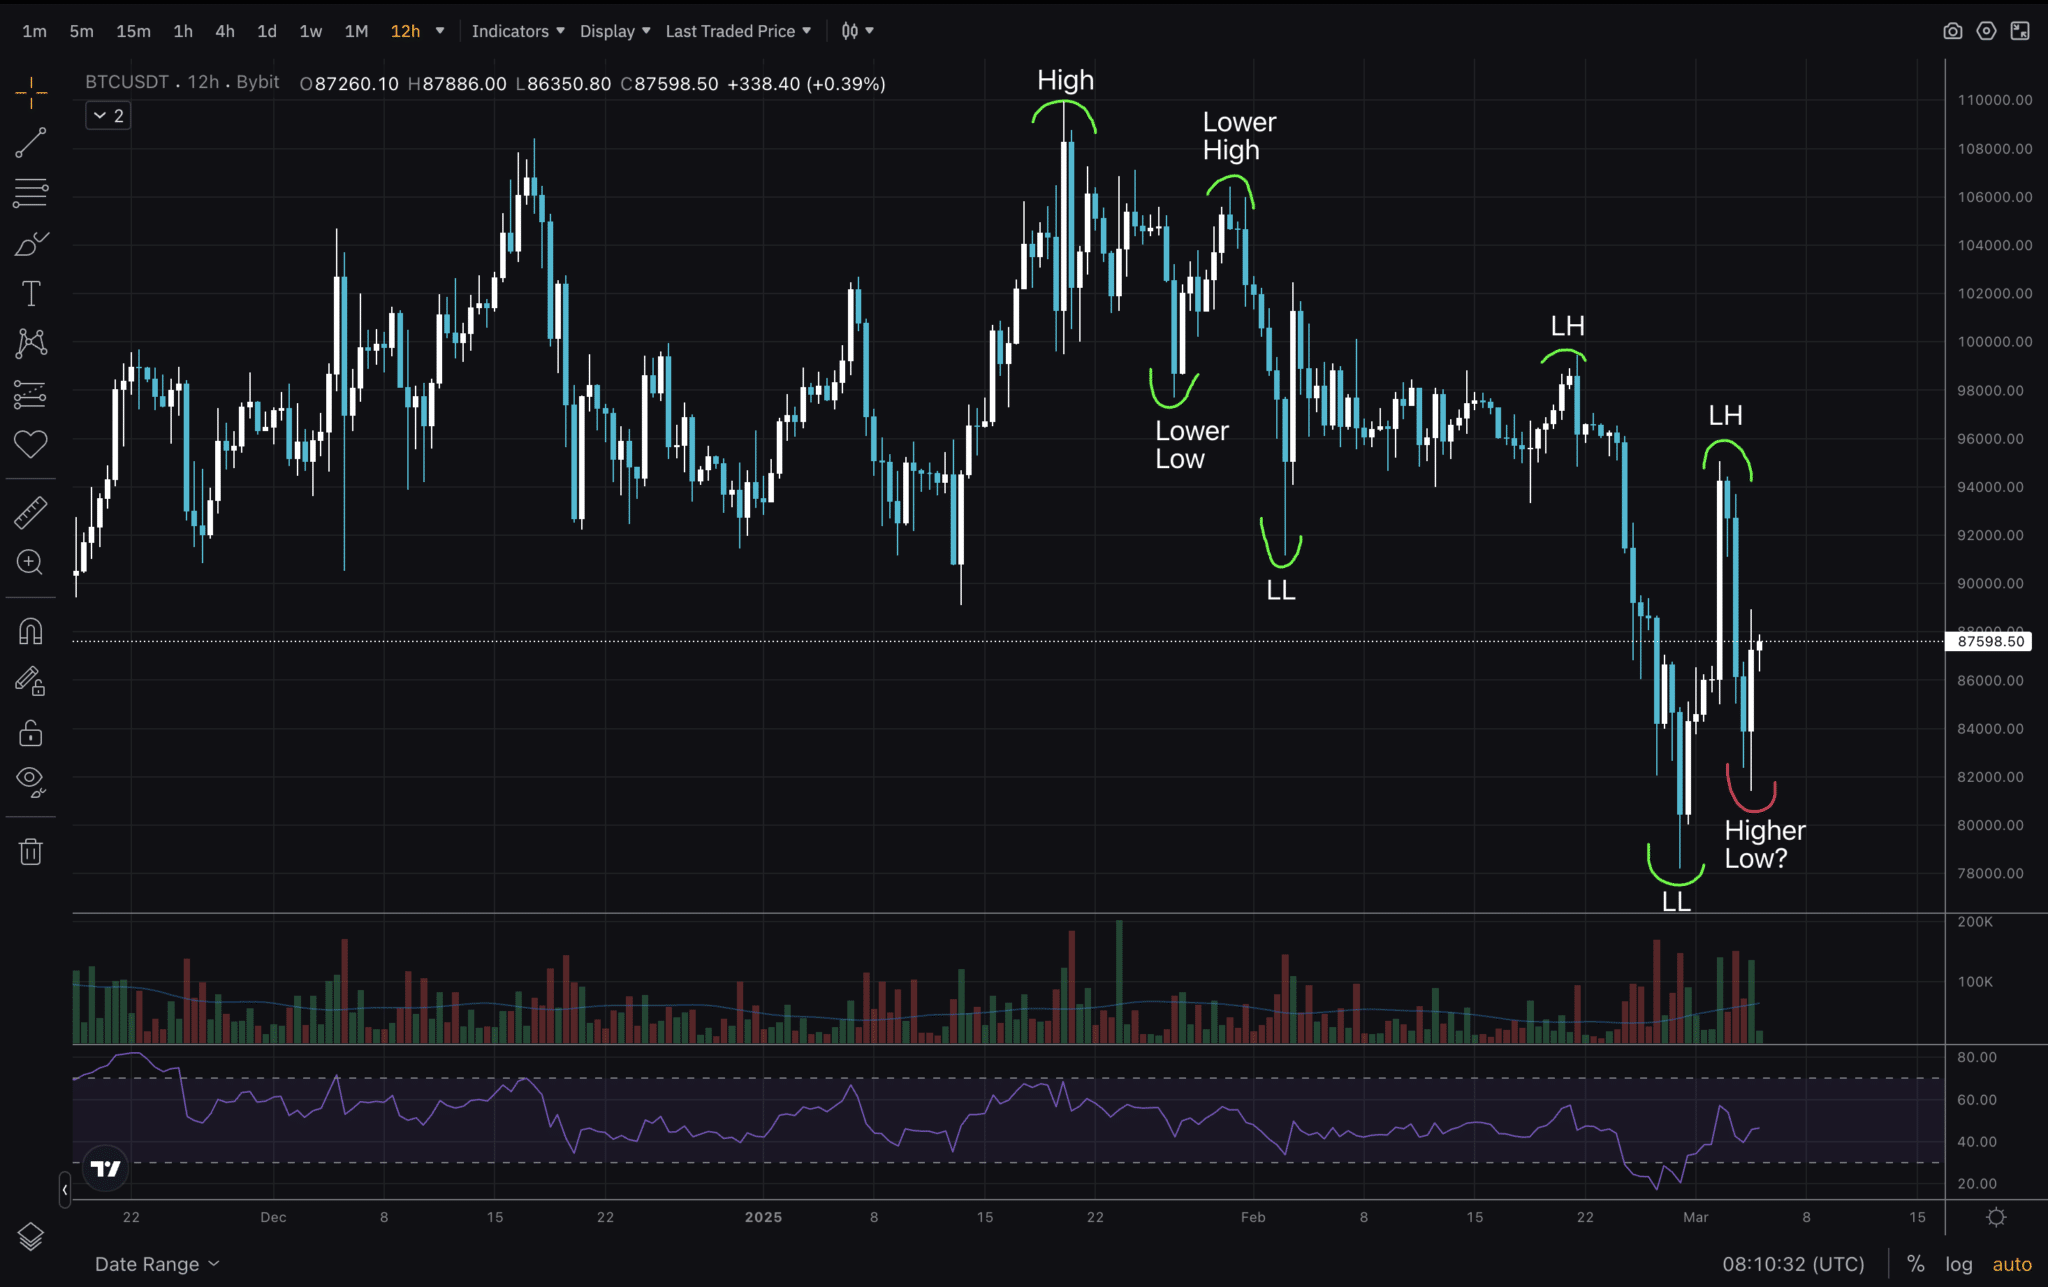
Next, we’re looking at the 12H timeframe for BTC Price Analysis 2025, early March. On the top image, I’ve identified multiple lower highs and lower lows – typical for a down trend. The last low seems to be higher than the previous. It’s good to keep an eye if it holds. Or will we see a lower low in the upcoming days? A great sign will be if we see a higher high form. That, and another higher low indicates a shift in trend.
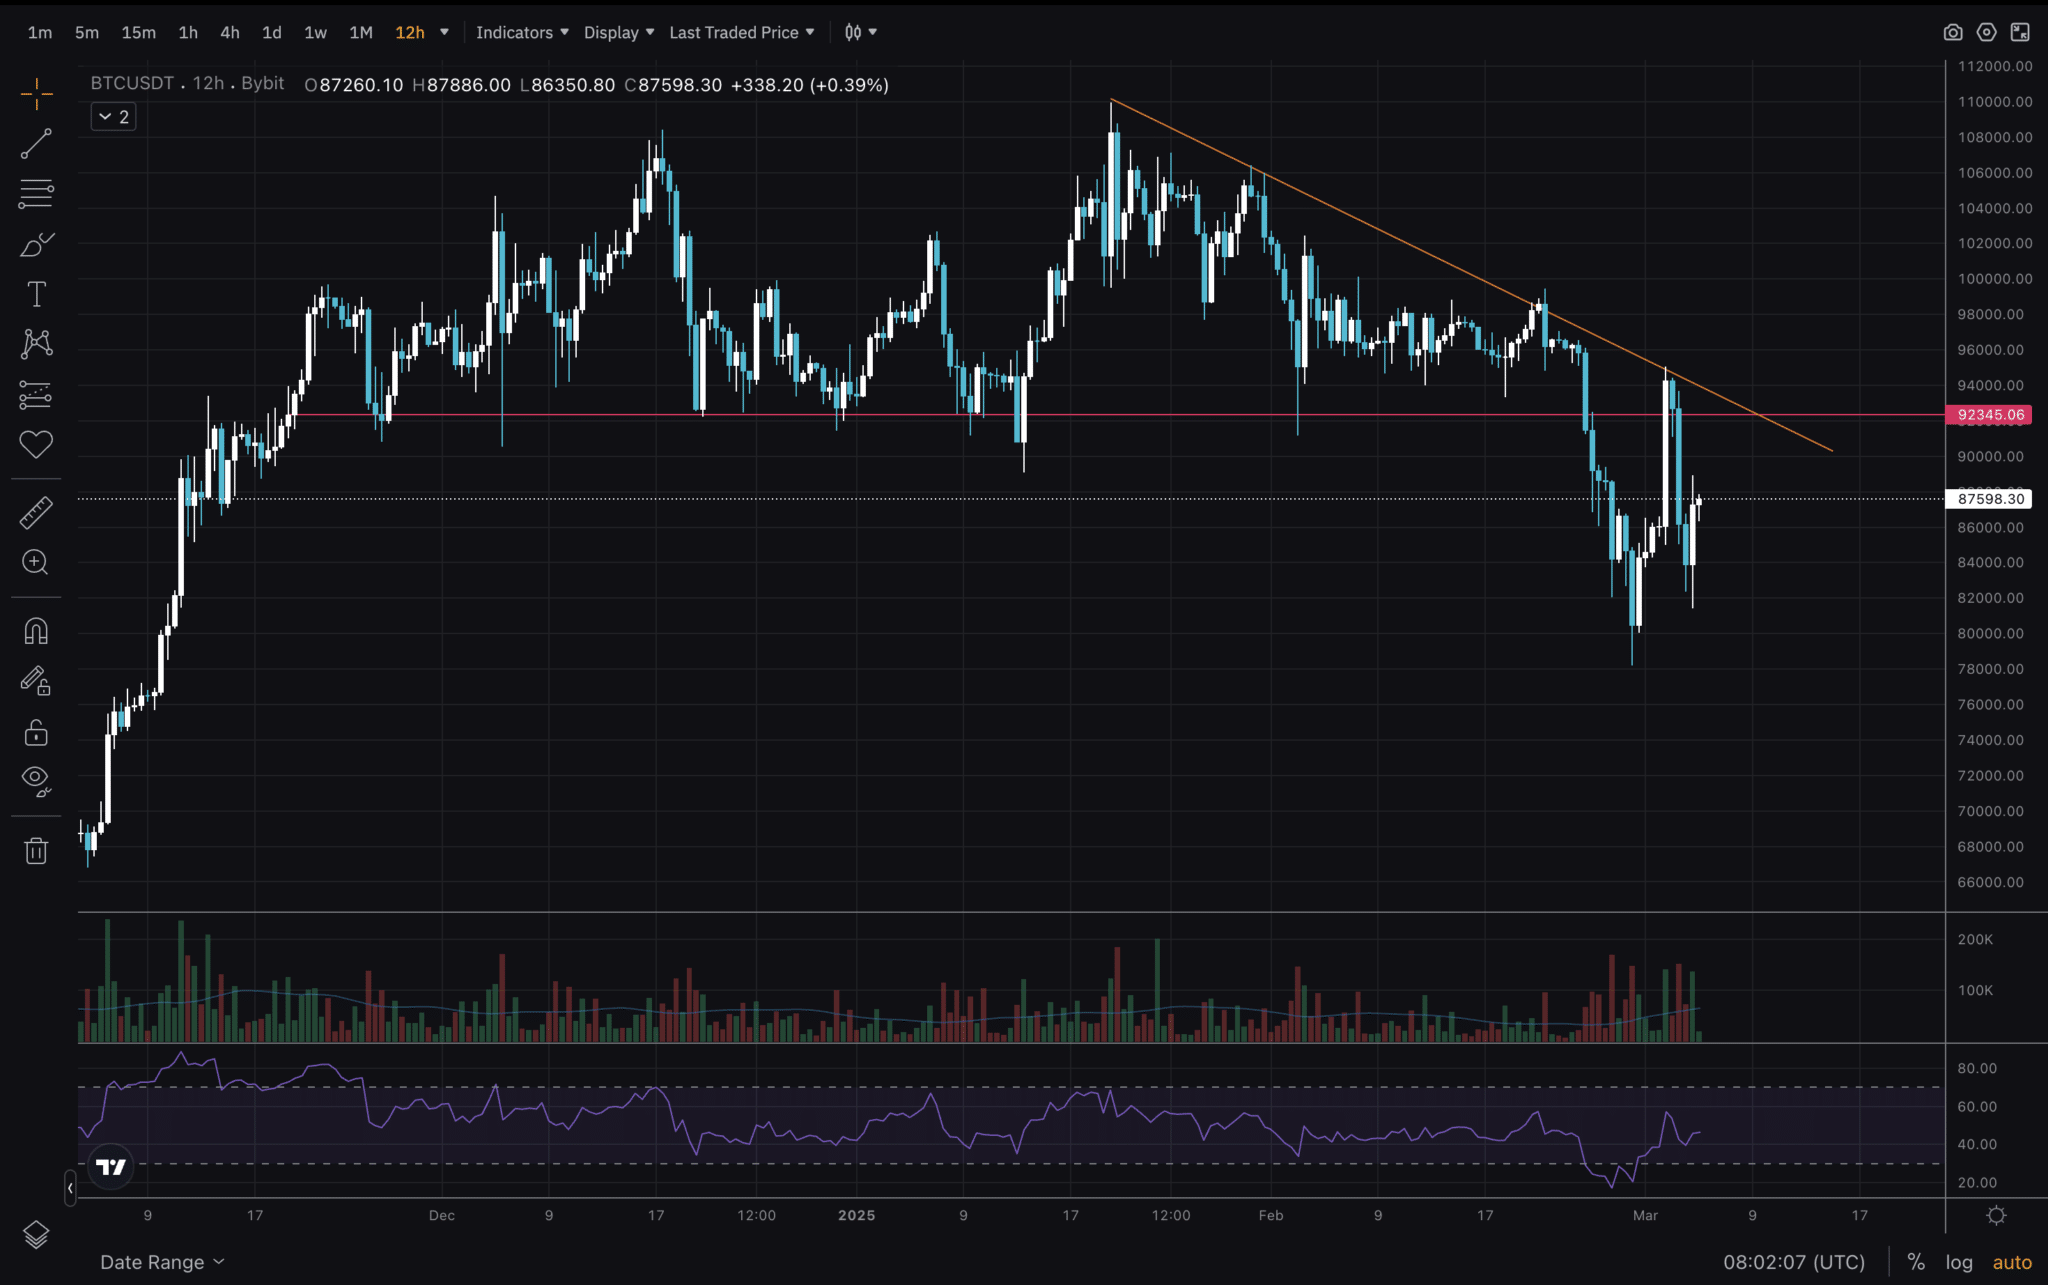
Looking at the bottom image, the orange line clearly defines the downtrend. We want to break above it. With that, for extra confluence, we’d love to see price reclaim, close and hold above the $92,000 level. All of these will be indicators for upward continuation.
DISCOVER: Polkadot Staking
BTC: Technical and Price Analysis Amid Trump’s Crypto Buzz
- BTC is still in bullish trend, key levels holding well.
- Key indicators – MA, RSI, Fib retested, gap filled.
- Target to reclaim now is $92,000.
- Trump Crypto summit buzz could push price higher.
The post BTC: Technical and Price Analysis Amid Trump’s Crypto Buzz appeared first on 99Bitcoins.