XRP has been consolidating against both BTC and USDT after a period of strong volatility, finding support above key moving averages while remaining below major resistance levels.
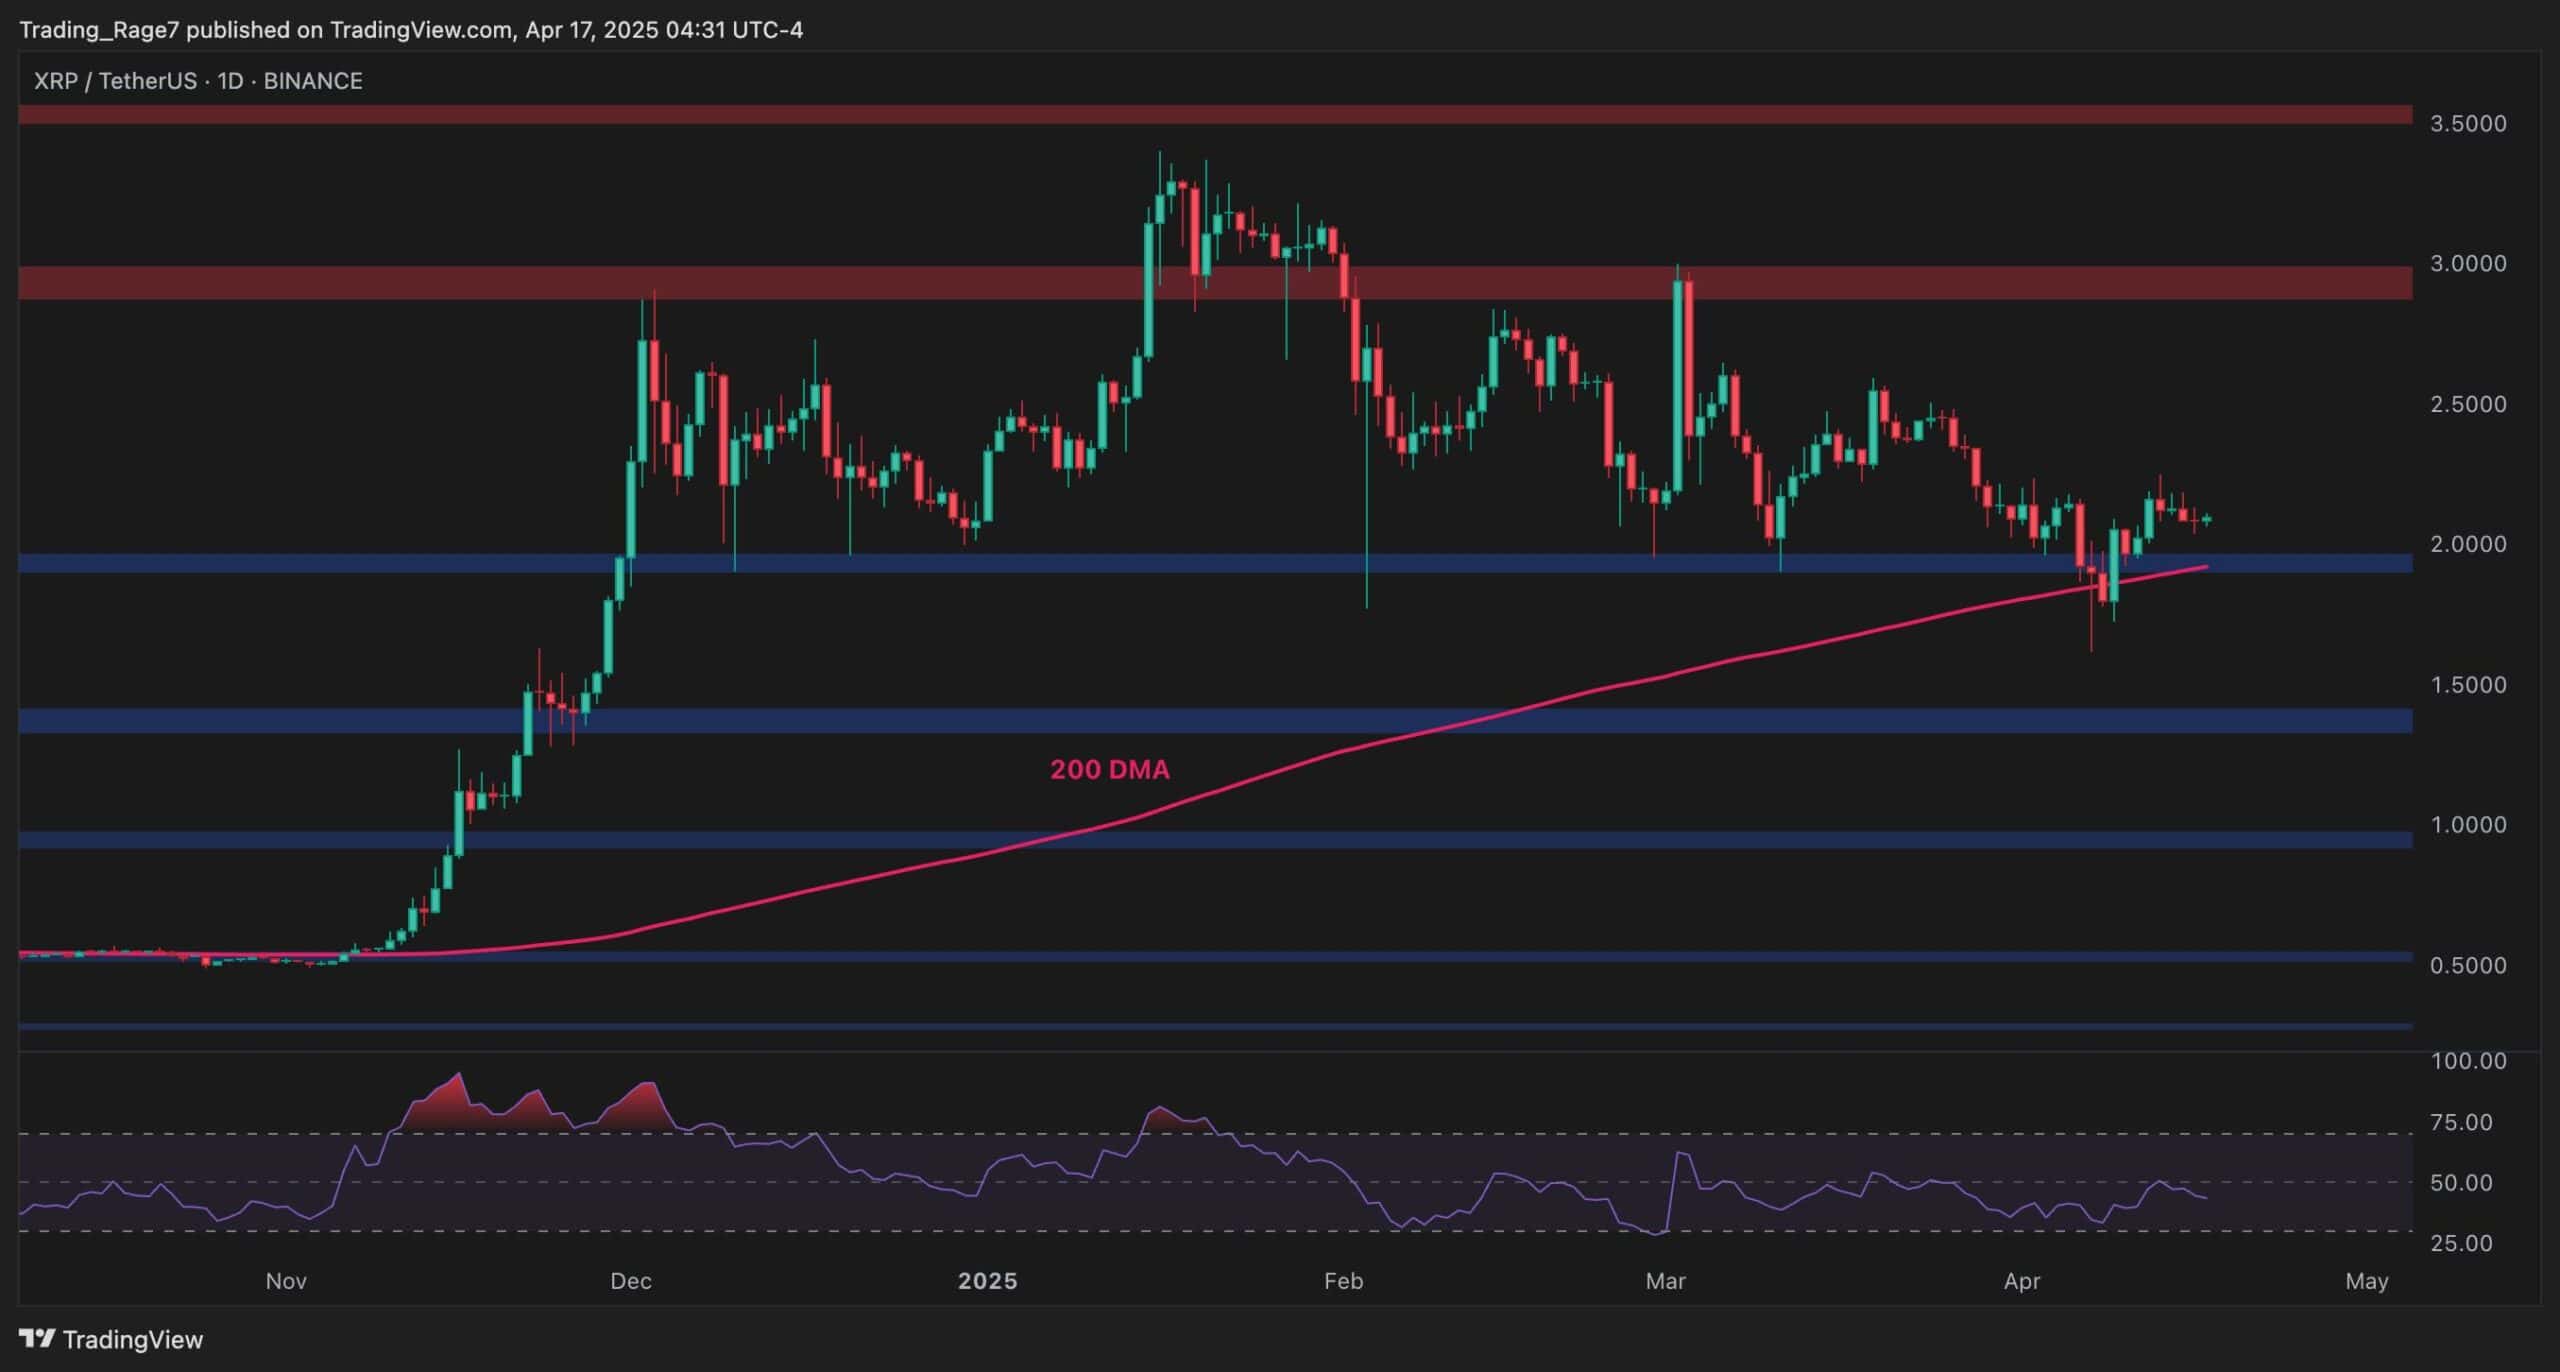
The USDT Paired Chart
On the XRP/USDT daily chart, the price is sitting just above the 200-day moving average and a critical horizontal support around the $2.00 zone. This level has acted as a battleground in recent weeks, as the asset has tested it multiple times.
The RSI is also hovering near the 50% level, reflecting the current equilibrium between buyers and sellers. A decisive close above the $2.5 area could open the door to a retest of the $3 level, while a breakdown below $2.00 would likely drag price back toward the $1.40 support level.
The BTC Paired Chart
Looking at the XRP/BTC pair, the structure reflects a broader sideways market, with multiple failed attempts to push above the 2,800 SAT zone. The price has made a series of lower highs recently, signaling some relative weakness against Bitcoin.
However, the 200-day moving average is creeping up toward the 2,200 SAT support area, offering a key level to monitor for trend confirmation. A clean breakout above the 2,800 SAT zone would mark the start of bullish momentum, while losing the 2,200 SAT level could lead to a deeper retracement toward the 1,800 SAT region or even lower.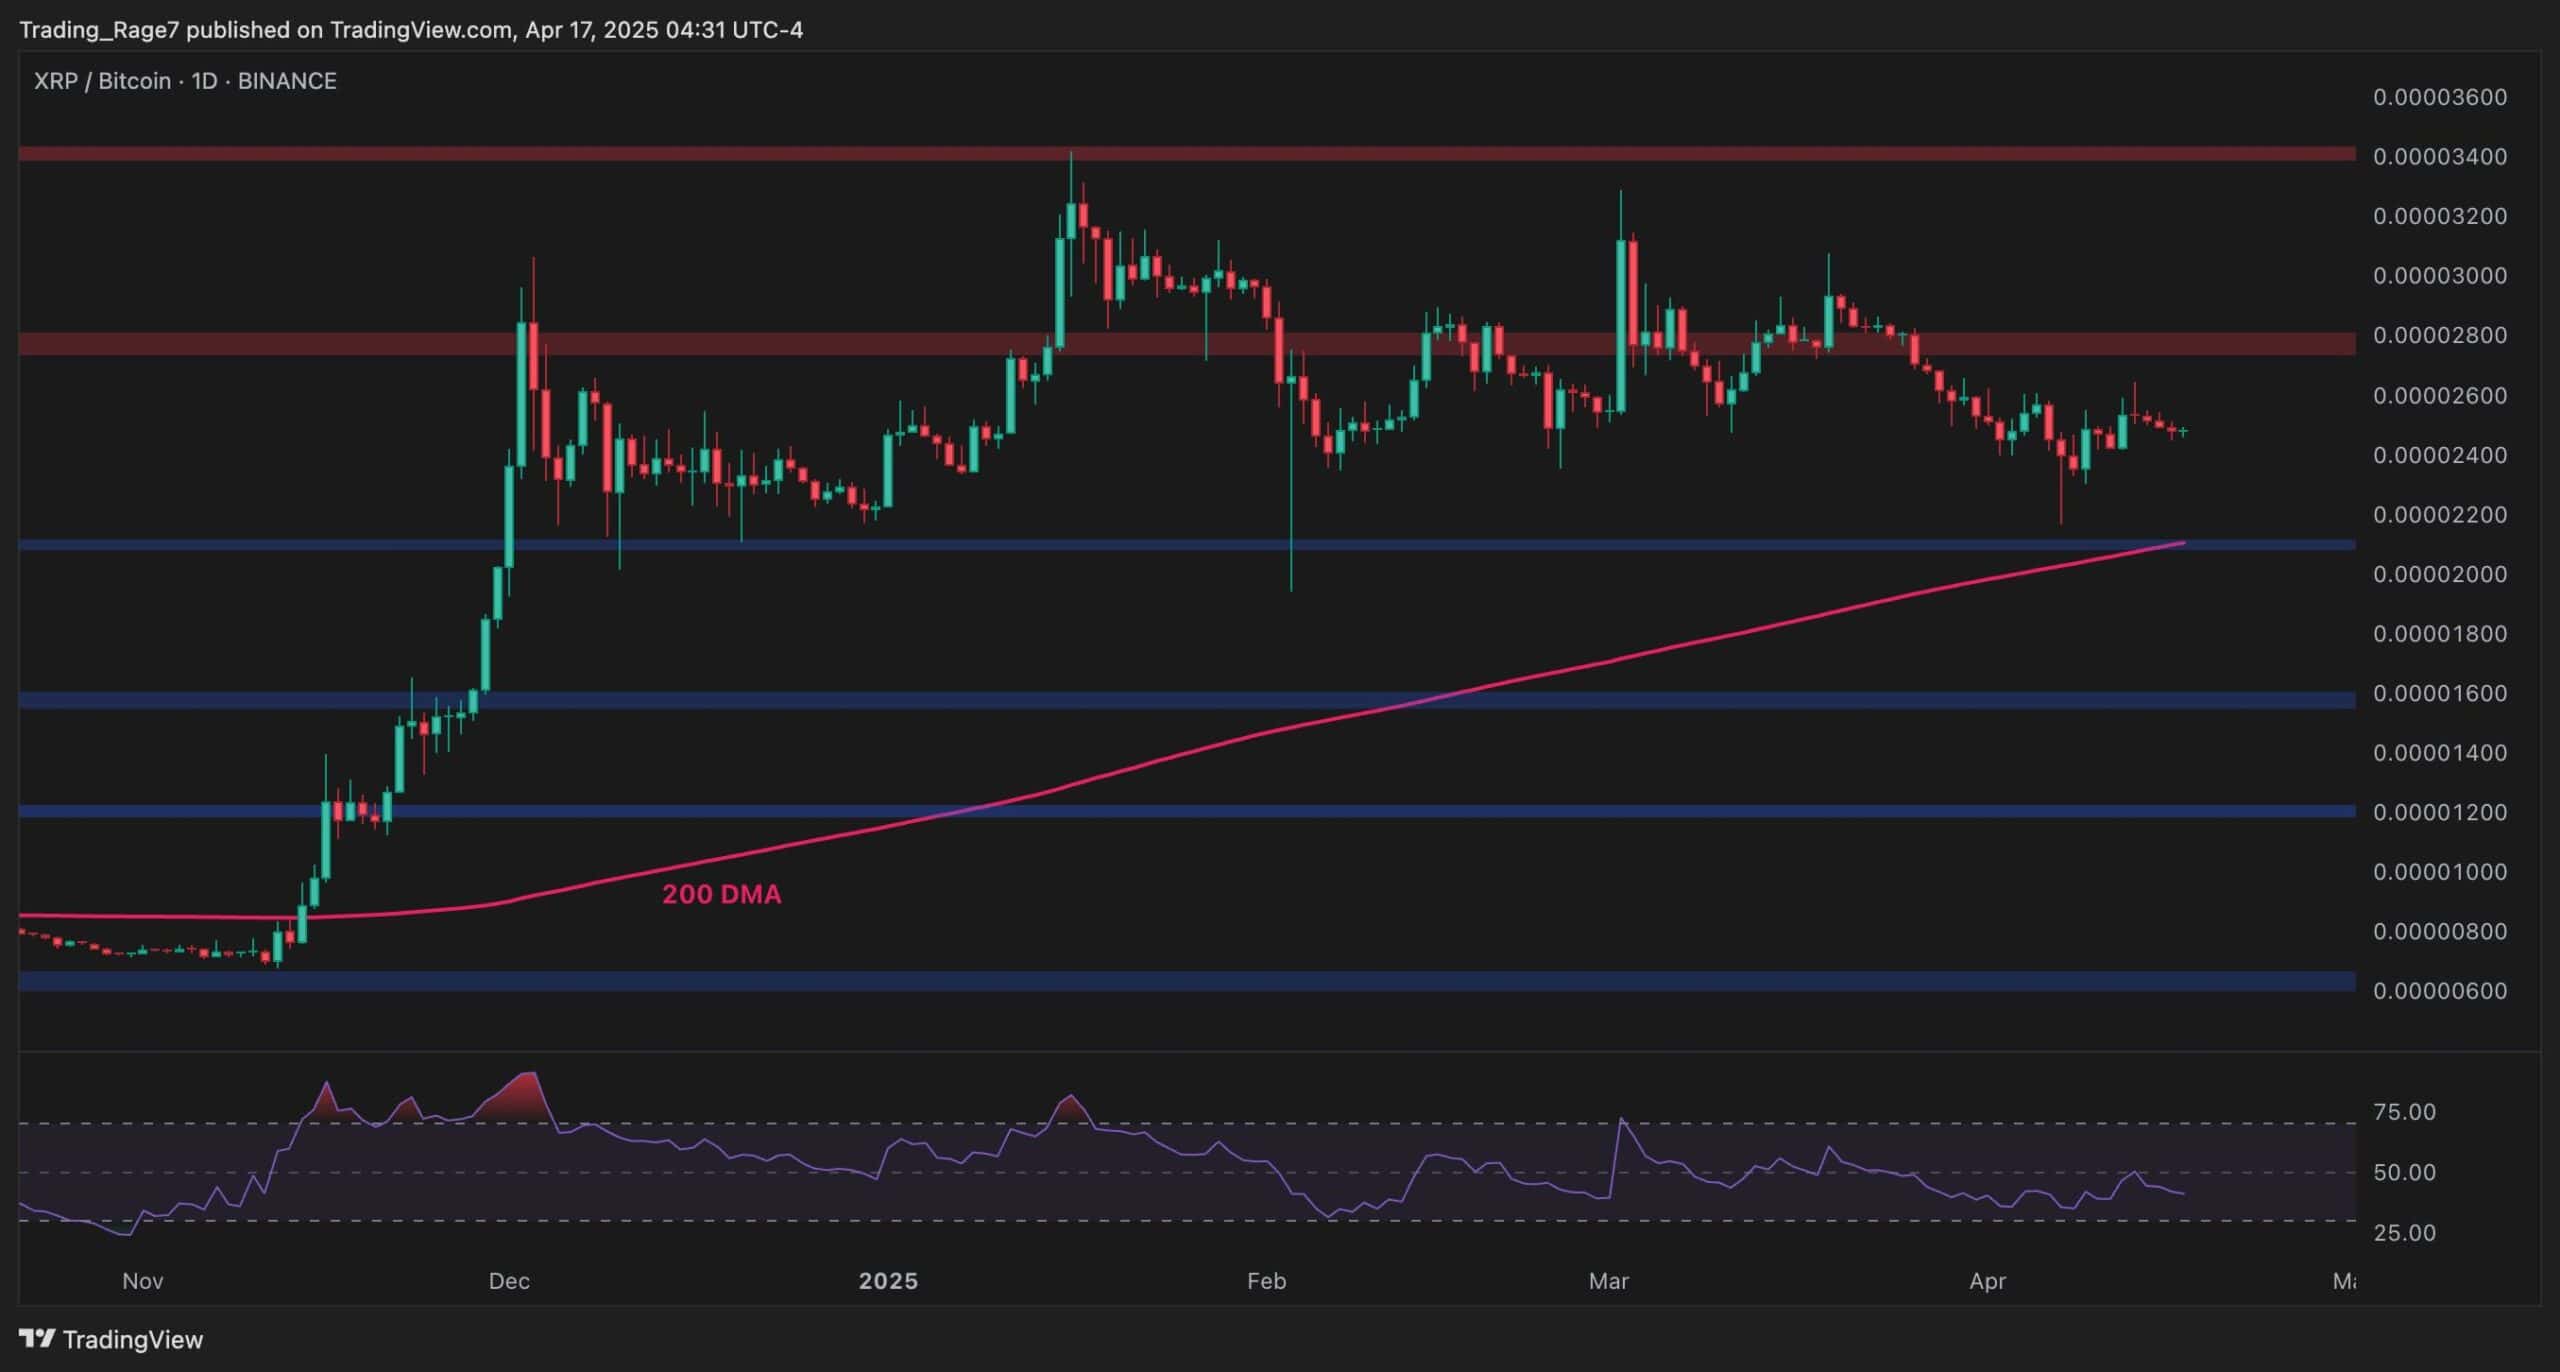
The post Ripple Price Analysis: Is $3 or $1.4 Next for XRP? appeared first on CryptoPotato.