Ethereum traded around $1,579.64 on June 30, holding near a support area that has become important for short-term traders.
Summary
- Ethereum trades near $1,580 as eight of its last ten monthly candles remain red now.
- Falling open interest shows traders reduced leverage, but spot ETF outflows still pressure ETH demand.
- Technical indicators show early stabilization, yet ETH needs $1,700 to $1,800 to confirm strength again.
Crypto.news data showed ETH up 0.49% over 24 hours, while the token remained down 6.22% over seven days. Its 24-hour range stood between $1,559.22 and $1,630.03, with trading volume near $11.49 billion.
The move keeps ETH close to the same $1,500 to $1,600 zone that has shaped recent price action. Ethereum recently traded around $1,580 after several days of sideways movement between roughly $1,550 and $1,600. ETF selling and weak market sentiment kept recovery attempts capped near the $1,600 area.
Ethereum remains the second-largest crypto by market value, but the current chart shows a weak long-term setup. Crypto.news data placed ETH’s market cap at about $190.62 billion, while the token remained 68.06% below its Aug. 24, 2025 all-time high of $4,946.05.
Ethereum monthly chart points to weak trend
Trader Jesse Olson said Ethereum’s monthly chart was close to printing a lower low because price was closing below monthly support. He also said, “8 of the last 10 monthly candles have been red.” That reading adds to concern that ETH has not yet formed a clean long-term reversal.
Olson also argued that many long-term Ethereum buyers remain underwater unless they already sold to lock in gains. His view reflects the scale of ETH’s drop from its 2025 peak and the failure of several recovery attempts since then.
Daan Crypto Trades also focused on the same weak structure. He said ETH has failed several attempts to reclaim previous support levels and added that a move back above $1,750 would be the first sign of strength on higher time frames.
That level now sits above the current trading range. If ETH cannot hold the $1,500 area, traders are likely to watch the April 2025 lows as the next downside zone. If buyers reclaim $1,700 to $1,800, the market would have a stronger base for recovery.
Ethereum leverage reset lowers crowded risk
CryptoQuant analyst Amr Taha said Ethereum derivatives positioning has reset across major exchanges. Binance ETH open interest dropped to about $1.95 billion on June 30, its lowest level since February, while Gate.io open interest fell to a chart low near $1.84 billion.
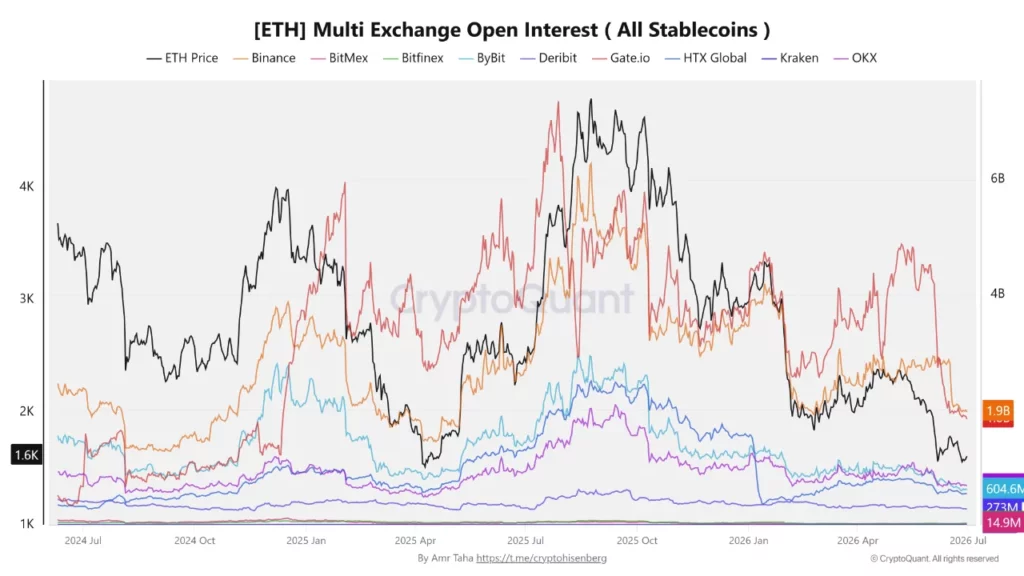
The Gate.io reading sits below the $2.67 billion level seen on April 11, 2025, when ETH traded near $1,570. That means Gate.io leverage is now roughly 31% lower than it was during that earlier market-bottom period, according to the analyst’s data.
Combined open interest on Binance and Gate.io has fallen to about $3.79 billion. Lower open interest means fewer leveraged positions are crowding the market. It can reduce forced selling risk, but it does not create demand by itself.
The reset gives ETH a cleaner derivatives setup than earlier in the year. Still, traders have not yet shown enough spot demand to push the token back above higher resistance. That leaves Ethereum in a fragile zone, with lower leverage but weak trend control.
Spot demand rises as ETF outflows continue
CryptoQuant analyst Abdullah Zia said Ethereum spot activity is increasing relative to leveraged trading. He said this can show that whales and longer-term investors are buying ETH through spot markets rather than chasing short-term leverage.
That signal gives bulls one positive data point. It suggests some buyers may be accumulating while derivatives traders step back. A spot-led recovery usually has stronger footing than a leverage-led rally because it is less exposed to liquidation cascades.
At the same time, U.S. spot Ethereum ETFs remain a source of pressure. As reported by crypto.news, spot Ethereum ETFs recorded $273 million in net outflows during the week ending June 26, marking seven straight weeks of withdrawals. BlackRock’s ETHA accounted for $236 million of those outflows.
ETF outflows matter because fund redemptions can force issuers to sell underlying Ether. That selling has repeatedly limited recovery attempts near $1,600. Ethereum ETF outflows also weighed on ETH earlier in June while macro pressure and weak technicals kept the token close to support.
Technical indicators show early stabilization
The RSI stood near 35.16, slightly below its moving average near 36.56. That shows weak momentum. The reading is not in deep oversold territory, but it remains well below the neutral 50 level.
MACD showed mild improvement. The histogram was positive near 2.52, while the MACD line near -74.94 sat above the signal line around -77.46. That means bearish momentum has eased, though both lines remain below zero.
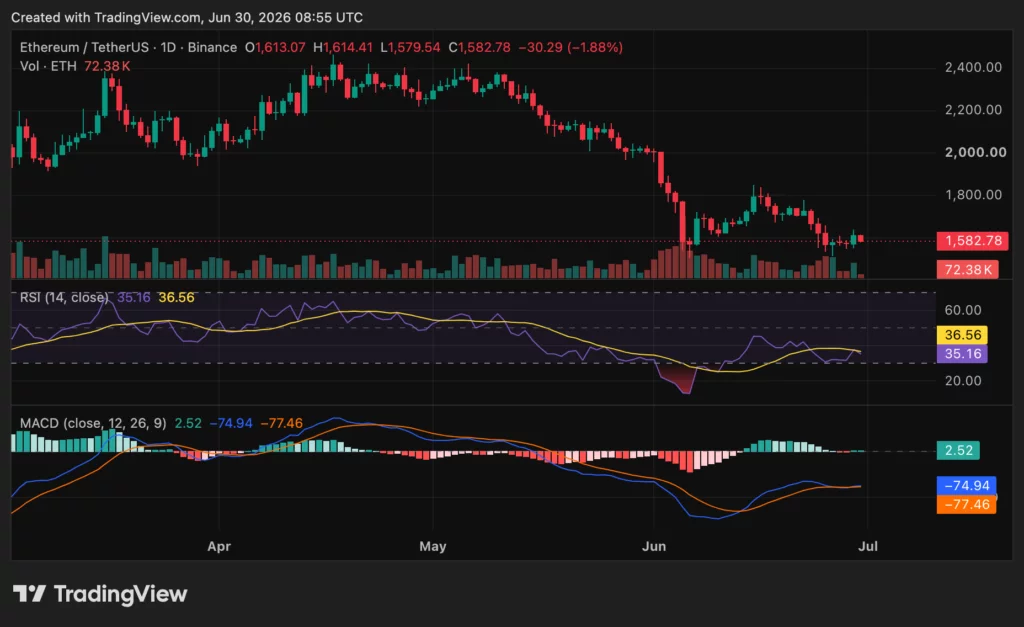
These indicators point to early stabilization, not a confirmed recovery. ETH still needs stronger buying volume, a move above $1,700 to $1,800, and RSI above 50 before the trend improves.
As reported by crypto.news, Ethereum’s weak price action contrasts with long-term fundamentals, including high staking participation, corporate treasury holdings and spot ETF assets. The same report noted that ETH remained below key moving averages while its ETH/BTC ratio sat near multi-year lows.
Disclosure: This article does not represent investment advice. The content and materials featured on this page are for educational purposes only.