Key Takeaways
- Bitcoin trades at $63,629, up over a percentage point, after recovering from a $59,100 low that took place on June 4.
- Moving averages signal a strong sell, while oscillators like RSI at 38 stay neutral.
- Traders watch the $64,000 level, with $67,000 the next target on a confirmed breakout.
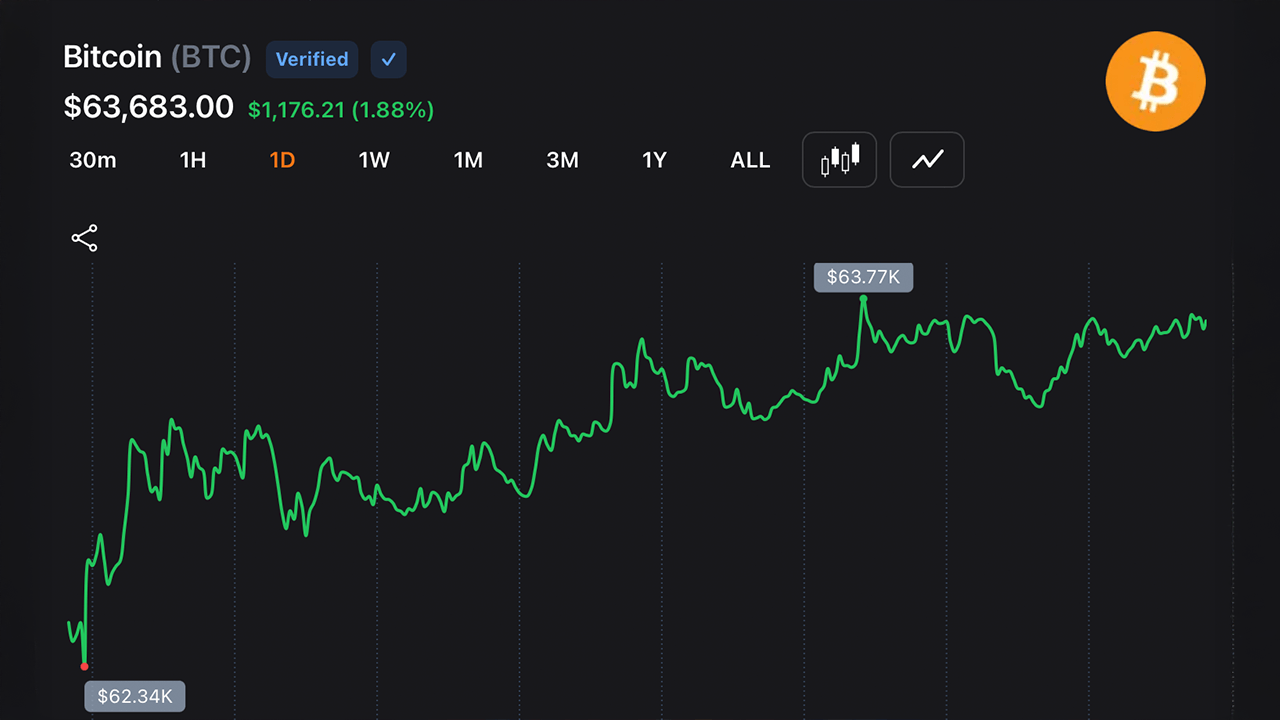
Daily Chart
The bounce off $59,000 produced a string of higher lows on the daily chart, and the price now consolidates between $63,000 and $64,000. Trading volume spiked during the capitulation phase and has since pulled back, a pattern that often points to fading panic selling rather than fresh distribution.
On the daily timeframe, resistance sits at $64,500 and again near $66,500, with major resistance layered at $67,000 to $68,000.

Support holds at $62,000 to $63,000, with major support at $59,000 to $60,000. The recovery structure stays intact as long as Bitcoin holds above $62,000.
4-Hour Chart
The four-hour chart shows a clearer short-term uptrend. After the drop to the $62,200 low, the price built a sequence of higher lows and higher highs.

Recent candles show momentum slowing near $63,500 to $64,000, a pattern consistent with accumulation following the bounce. A break and hold above $64,000 to $64,200 opens a path toward $65,000, $66,000, and $67,000. A loss of $63,000 reopens the door to $62,200 and then $61,000.
1-Hour Chart
The one-hour chart points to consolidation. Price rose from the $62,200 low and has since compressed into a tight range, with resistance at $63,800 to $64,000 and support at $63,200 to $63,300. Sellers have not regained control, and the pattern reads closer to a flag than a reversal.

Bitstamp’s live order flow backs up the range-bound read. Spot price sat at $63,665.51 as of 8:07 a.m. EDT, with trades clustered tightly between $63,643 and $63,665 in sizes of 0.3 to 1.2 BTC. Order book depth shows denser interest below the current price, with counts rising toward $54,000, compared with thinner counts on the way up toward $73,500.
Oscillator and Moving Average Tape
Oscillator readings stay mostly neutral. The 14-day relative strength index ( RSI) sits at 38, the Stochastic reads 48, and the commodity channel index (CCI) shows a negative 20. The average directional index (ADX) sits at 38, all landing in neutral territory with no overbought or oversold extremes.
The moving average convergence divergence ( MACD) level reads negative 2,248 but registers a bullish signal, while momentum (10) at 2,195 also reads bullish. The Awesome oscillator, at negative 4,704, is the lone bearish signal. The combined oscillator tape today lands at neutral.
Moving averages tell a different story. Every short and medium-term exponential moving average (EMA) and simple moving average (SMA), from the 10-period to the 200-period, sits above the current price and signals sell. The 200-day EMA sits at 77,964 and the 200-day SMA at 76,876, both far above the $63,630 spot price. That overhead positioning produces a strong sell bias across moving averages, even as oscillators stay flat.
Traders are watching $64,000 as the level that decides the next move. A break and hold above that zone favors continuation toward $66,000 to $67,000. A drop below $63,000 favors a retest of $62,200 and potentially lower. With Bitcoin’s 24-hour range running from $62,335 to $63,770, the asset remains in a defined band pending a decisive break in either direction.
Bull Verdict:
Bitcoin holds above $62,000, and the structure since the $59,100 low still favors buyers. Higher lows on the four-hour chart, fading volume during the selloff, and tight order flow on Bitstamp all point to a market that absorbed the panic rather than extending it. A close above $64,000 opens a direct path to $65,000, $66,000, and $67,000. The moving averages sit overhead, but oscillators show no exhaustion. Buyers haven’t lost control of this range.
Bear Verdict:
Every short and medium-term moving average sits above current price, and that overhead supply doesn’t disappear because oscillators went flat. Bitcoin is trading roughly $14,000 below its 200-day EMA, a gap that keeps sellers in position on every bounce. A drop below $63,000 reopens $62,200, then $61,000, with the $59,100 low still in range if support fails. Until price reclaims $64,000 and holds it, the path of least resistance runs through resistance, not support.