Bitcoin has staged a sharp recovery from the lower end of its recent range, pushing back toward $70K after spending several weeks consolidating below a descending trendline. The latest move has improved the short-term structure considerably, although BTC is now approaching an important resistance cluster that could determine whether this is the start of a broader recovery or simply a range breakout that needs confirmation.
Bitcoin Price Analysis: The Daily Chart
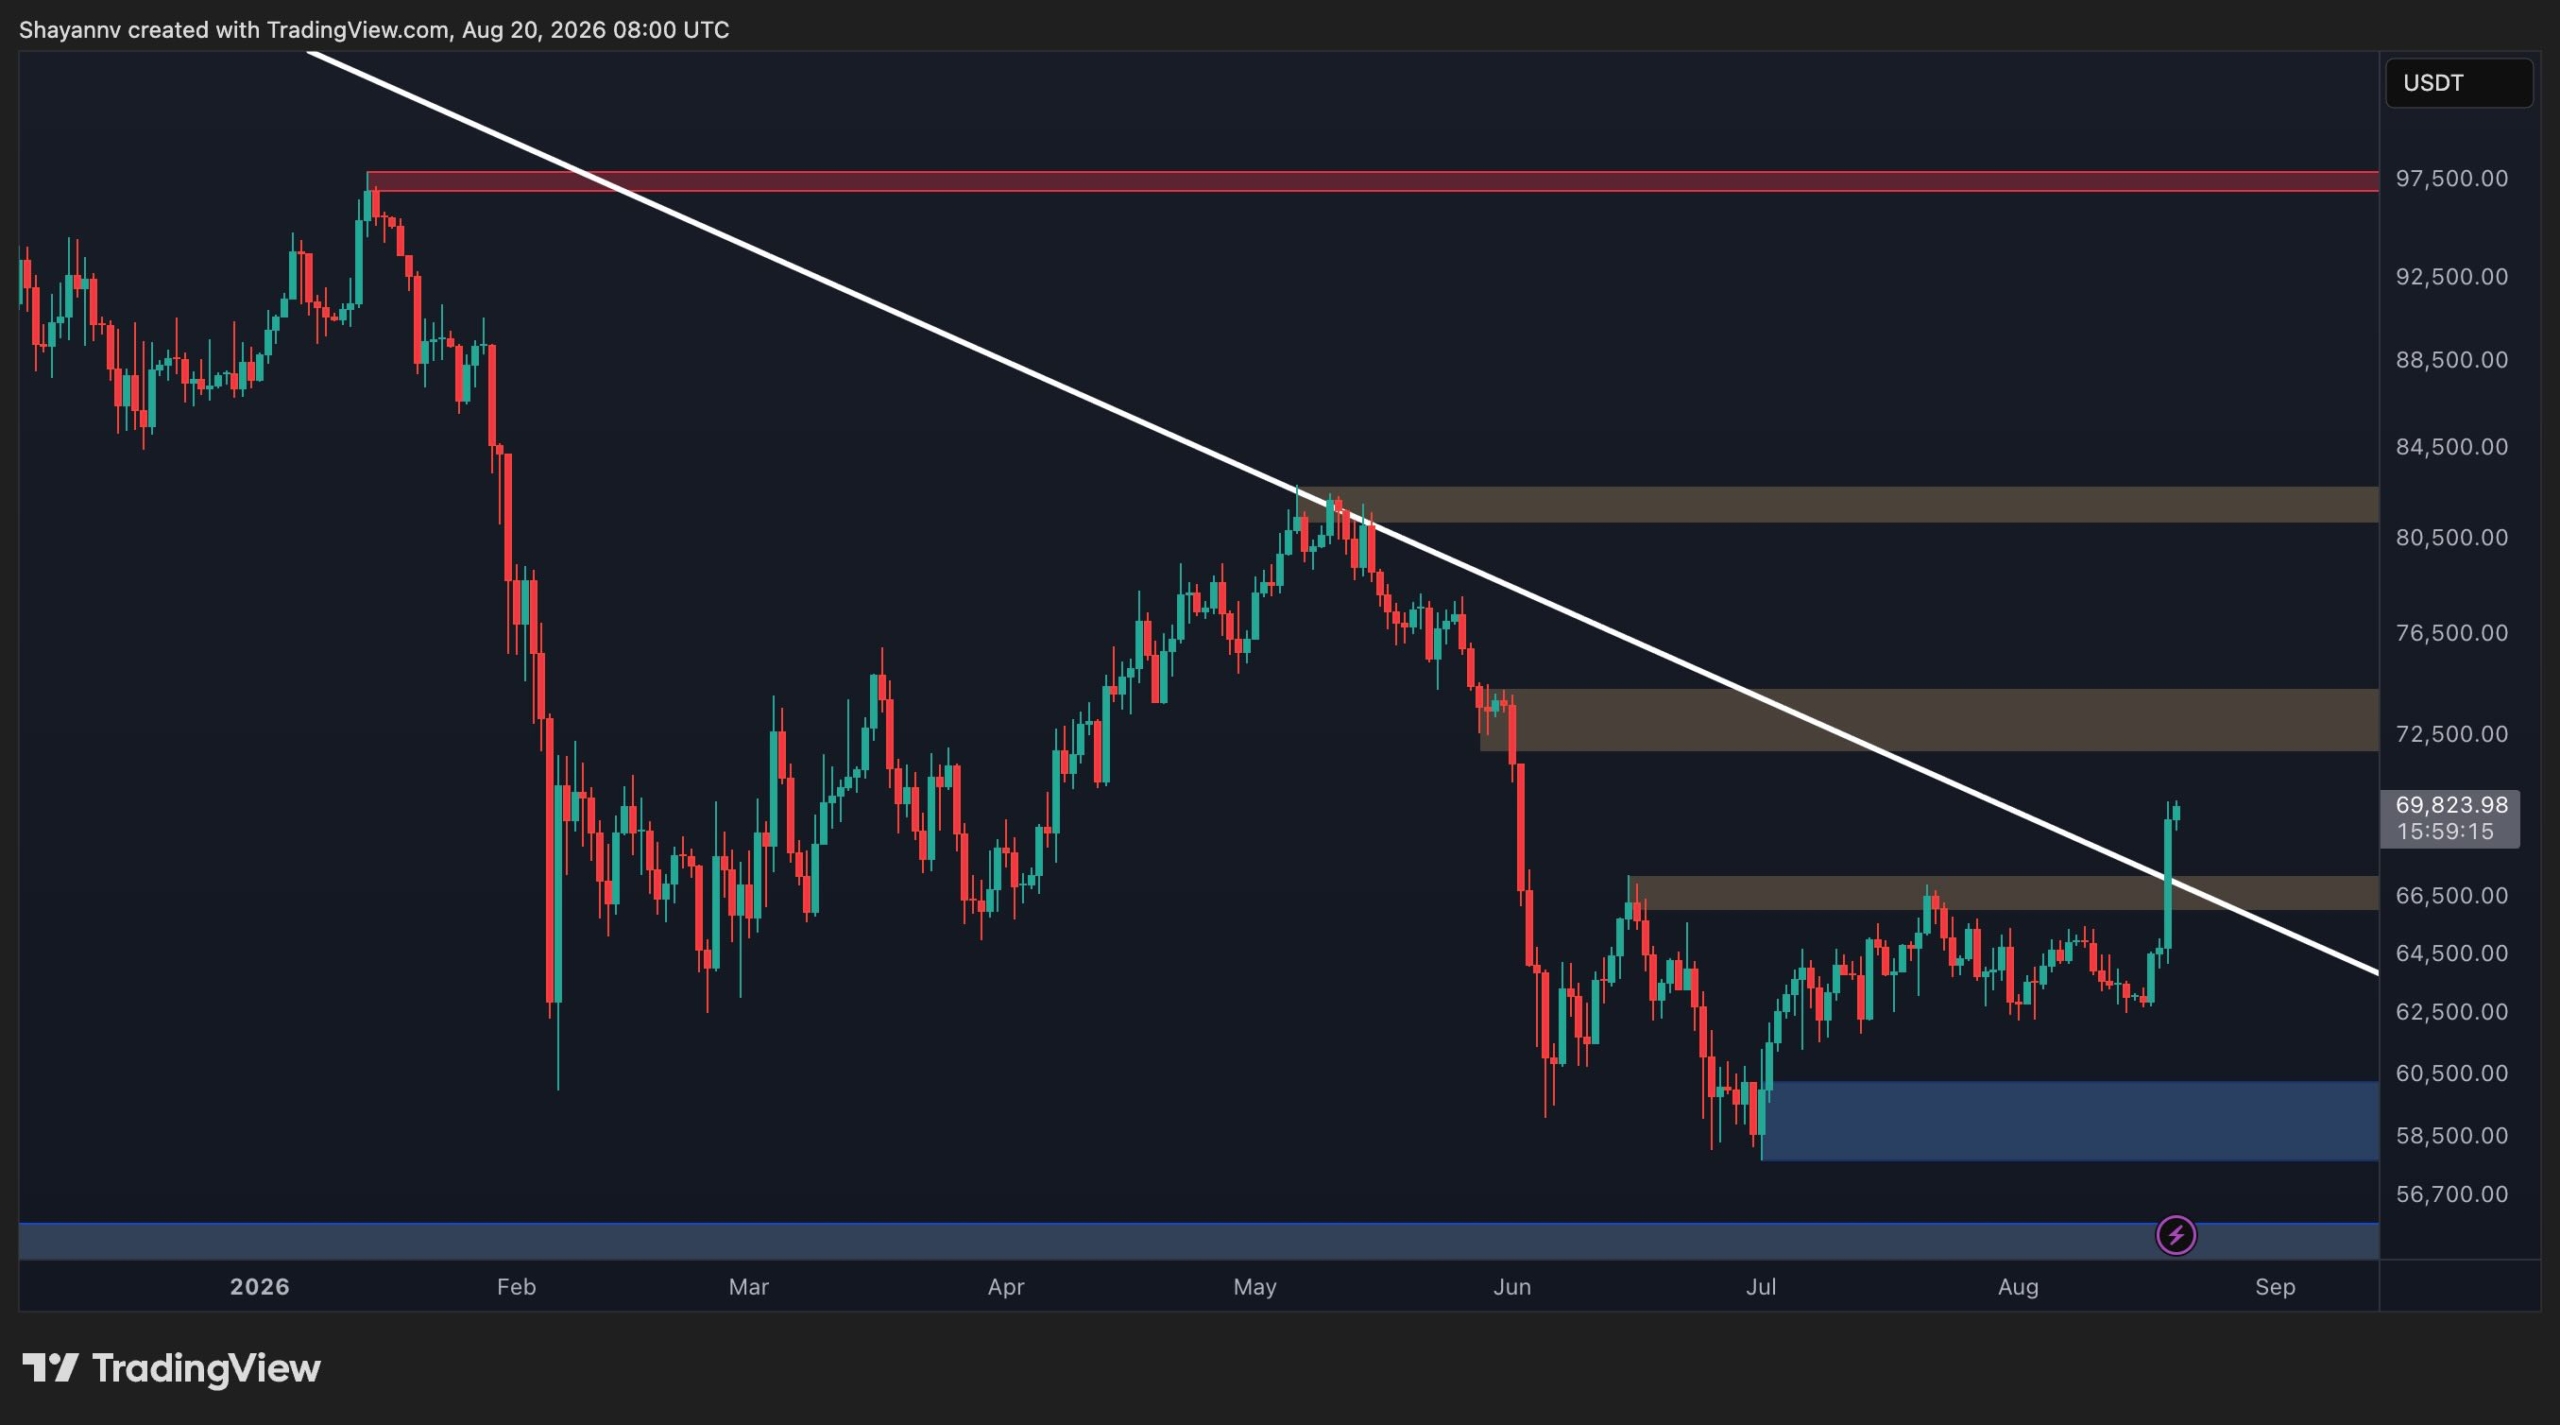
The daily chart shows Bitcoin recovering from the $60K support area after a prolonged decline from the all-time highs. The price subsequently formed a broad consolidation structure, with the market repeatedly finding buyers around the $60K-$62K region while rallies were capped by a descending trendline.
The most important development is the latest breakout. BTC has moved decisively above the long-term descending trendline and the $66.5K resistance zone, with the asset currently around $72K. This represents a meaningful structural improvement because the trendline had been containing the recoveries for months.
However, the breakout is now facing its first major test. The $72K-$74K area represents the next significant resistance zone visible on the chart. A sustained move through this region would strengthen the bullish case and potentially expose the $80K-$82K resistance area next.
On the downside, the former $66.5K resistance zone is now the first important area to monitor. A daily close back below this region would weaken the breakout and raise the possibility of a return toward the critical $60K demand zone.
Overall, the daily structure has shifted from a clear sequence of lower highs into a potential bullish reversal. Confirmation above $66.5K would be important, while failure to hold that zone could turn the recent move into a false breakout and likely lead to another capitulation event.
BTC/USDT 4-Hour Chart
The 4-hour chart provides a clearer picture of the immediate breakout. BTC had been trading inside a contracting structure, characterized by a descending upper trendline and a gradually rising lower boundary. This created a compression pattern that persisted from July into mid-August.
The breakout finally occurred, and Bitcoin surged through both the descending trendline and the $66K-$67K resistance zone. The move was particularly aggressive, with BTC quickly advancing from the mid-$64K area toward $70K.
The $66K-$67K zone is therefore the key short-term pivot. As long as Bitcoin remains above it, the breakout structure remains intact, and the market could continue toward the next daily resistance around $72K-$74K.
At the same time, the speed of the move means a retest would not necessarily be bearish. A pullback toward $66K-$67K followed by a successful rebound could provide stronger confirmation that the former resistance has turned into support.
For now, momentum clearly favors the buyers on the 4-hour timeframe, but the next challenge is whether buyers can convert the breakout into sustained price acceptance above $70K.

On-Chain Analysis
The futures average order size chart provides an additional perspective on the recent price action. The indicator separates futures activity into normal orders, big whale orders, small whale orders, and retail orders, allowing the composition of trading activity to be viewed alongside Bitcoin’s price.
The recent price recovery from the $60K area toward $70K has featured a mixture of normal and whale-sized orders, with green and light-green clusters appearing repeatedly during the advance. This suggests that larger orders have remained active around the latest recovery rather than the move being driven exclusively by smaller retail transactions.
At the same time, the chart shows substantial red retail-order clusters during several previous major price swings, including periods around the $70K region and the subsequent decline. The latest advance toward $70K does not show the same degree of persistent retail-order dominance visible during some earlier rallies.
That backdrop is constructive, although the indicator alone does not establish whether the larger orders are predominantly long or short. The more important takeaway is that the current price recovery is occurring alongside renewed activity from larger futures participants.

Disclaimer: Information found on CryptoPotato is those of writers quoted. It does not represent the opinions of CryptoPotato on whether to buy, sell, or hold any investments. You are advised to conduct your own research before making any investment decisions. Use provided information at your own risk. See Disclaimer for more information.

